Douglas County
A Traffic Safety Summary
2020-2022
Introduction
This document was created by the Division of State Patrol Bureau of Transportation Safety and Technical Services (BOTSTS). The data is based on three-year (2020 - 2022) trends.
The intention of this document is to assist Traffic Safety Commissions to examine their own transportation safety issues within their respective county and to identify potential countermeasures. While these crash and driver behavior trends are examined at the county level, these trends can be examined at a more local level. BOTSTS can provide this analysis and data to your local municipality.
For requests, email BOTSTS at CrashDataAnalysis@dot.wi.gov.
Zero in Wisconsin
![]()
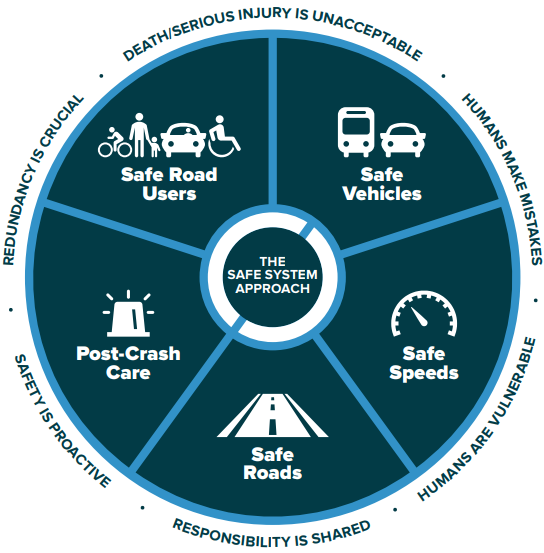
WisDOT has adopted Zero in Wisconsin, the belief that no one should be killed or seriously injured from using the road network. The aim of Zero in Wisconsin (otherwise known as Safe System, Vision Zero or Sustainable Safety) is for a world free from road fatalities and serious injuries.
The Safe Systems Approach
aims to eliminate fatal & serious injuries for all road users. It
does so through a holistic view of the road system. It provides a
safety-net for the user by anticipating human error and accommodating
human injury tolerance. The chart shows these five elements. Here are
suggestions
your community can make using these elements.
Learn more about
this approach at the
Federal
Highway Administration and Zero
in Wisconsin.
Crash Trends
Deer crashes
Property-damage only deer crashes
were excluded from
this report. Deer-related crashes make up 12% of property damage
crashes in Douglas County with November being the month with the
highest number of deer crashes (property damage only).

Per year in Douglas County, an average of
 |
While |
| 1,183 drivers are involved in a crash |  |
 |
December has the highest number of crashes |
| 185 people are injured |
 |
|
May has the highest number of injury and fatal crashes |
| 6 people are killed |  |
| Where | 7 out of 10 injured or killed people are Douglas County residents |
 |
 |
| 2 out of 10 fatal and injury crashes occur on a county or state road | 16 out of 20 injured or killed people are Wisconsin residents |
| When | |
 |
|
| 3pm-4pm is the peak time for injury and fatal crashes |
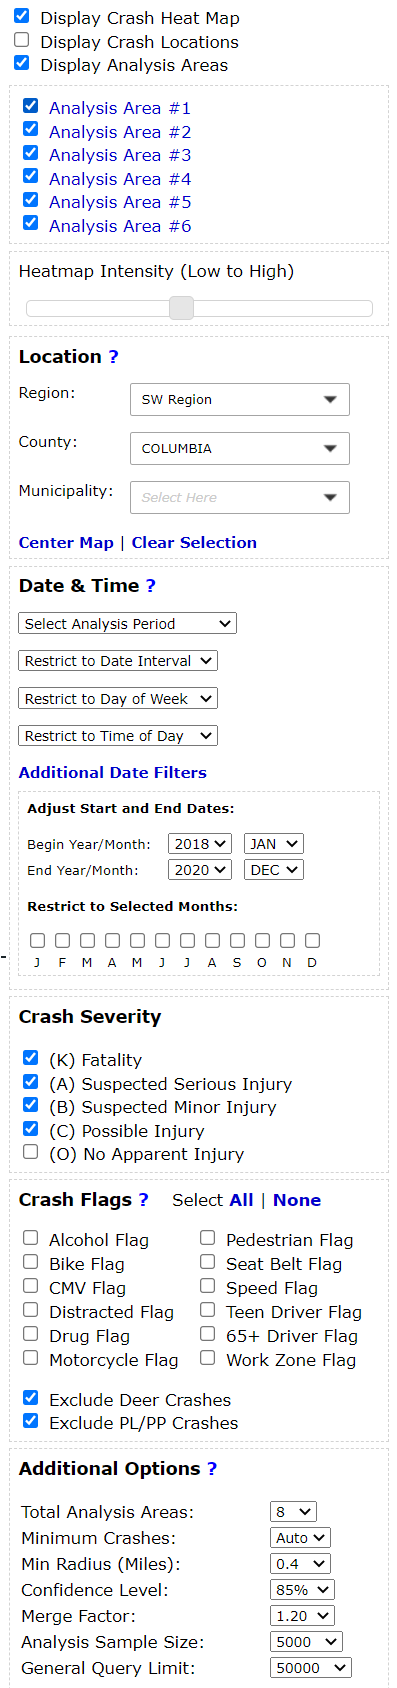
Heat map of all crashes (2020 - 2022)
Explore crash hotspots in your local community in Community Maps. If you work for a public agency, you may request a log-in to gain access to advanced search and analysis capabilities.
On an average year in Douglas County, Friday has the highest number of injury and fatal crashes. In addition, over a 24-hour period, injury and fatal crashes occur most frequently between 3pm-4pm peaking at 12 crashes in total throughout the year.
| Crash Type | 2018 | 2019 | 2020 | 2021 | 2022 | Trend |
|---|---|---|---|---|---|---|
| Fatal | 3 | 4 | 4 | 6 | 6 | |
| Injury | 167 | 135 | 143 | 151 | 149 | |
| Property Damage | 697 | 821 | 460 | 637 | 711 | |
| Total | 867 | 960 | 607 | 794 | 866 | - |
Here are trends of fatal, injury, and property damage crashes
over the past 5 years.
Crashes on U.S. roads are disproportionately represented in injury and fatal crashes. On roads with higher posted speed limits, there’s a higher risk for a severe injury or fatality if a crash were to occur.
Commuting Flows
Locals are more likely to be involved in a crash in Douglas County as opposed to visitors. 70% of occupants injured or killed in a crash in Douglas County also live in Douglas County.
Transportation Safety
Alcohol and Drug-Impaired Driving
In Douglas County, 27 people are injured or killed in a crash involving a driver believed to be impaired by drugs or alcohol, in an average year. That is 35% of all persons killed in a crash. Statewide, this is 32% of all persons killed.
While 75% of drivers believed to be impaired by drugs or alcohol are male.
Hotspots of alcohol and drug-related crashes with an injury or fatality (2020 - 2022)
Distracted Driving
In Douglas County, a driver being distracted is listed as a contributing factor in 35% of injury and fatal crashes. Statewide, this is 36% of injury and fatal crashes. Below shows the breakdown of the factors in these distracted driving crashes.
Occupant Protection
Statewide seat belt usage has been increasing over the past two decades. This past year experienced a usage rate of 87.5%, which is based on an annual seat belt survey. Occupants not wearing a seat belt are more likely to suffer a serious injury or fatality. Of the total statewide occupant fatalities, 1 out of 3 were not wearing a seat belt. Statewide seat belt usage rate reached an all time high in 2019.
People in your community can conduct their own seat belt survey via
the ‘Local Seat Belt Survey’ in the app store.

Bicyclist and Pedestrian Safety
Over the last 3 years in Douglas County, 15 cyclists and 24 pedestrians were killed or injured in 38 crashes. The two bar charts below shows the contributing factors and where these crashes occurred.
Let's take a look at the drivers in these 9 crashes where the bicyclist or pedestrian had 'No Improper Action'. 44% of drivers had a contributing action of Failed To Yield Right-Of-Way.
Explore where these bicycle and pedestrian
crashes are occurring in your local community at
Community
Maps.
Motorcycle Safety
In the last 3 years in Douglas County, 47 motorcyclists were killed or injured. Of these, 73% were not wearing a helmet.
Injury and fatal motorcycle crashes
[The type of helmet and other safety equipment worn, such as
protective gear and gloves, can also impact the type of injury
sustained.
43 motorcycle drivers
were involved in a fatal or injury crash. 12% were believed to be
impaired by drugs or alcohol. 88% were Wisconsin
drivers.
Teen and Older Drivers
In Douglas County, teen or older drivers make up 23% of drivers involved in a fatal or injury crash. Statewide, this is 22% of drivers in fatal and injury crashes.
Breaking this down for Douglas County:
120 teen drivers make up 11% of drivers involved in a crash and make up 4% of licensed drivers and
146 older drivers make up 13% of drivers involved a crash and make up 23% of licensed drivers.
Injury
and fatal crashes involving a teen driver Injury and fatal
crashes involving an older driver
Lane Departure Crashes
More lane departure crashes occur in Douglas County, out of total injury and fatal crashes, compared to the state. That is an average of 58 fatal and injury lane departure crashes per year. Colliding with a Ditch/Culvert was the most frequent first harmful event. Breaking this up, 82% are single vehicle only, while statewide 76% are.
A lane departure crash is defined as when the driver crosses the centerline, edge line, or leaves the roadway and then usually colliding with another vehicle or an object, such as a guardrail or a tree. The cause of a lane departure crash could be a mixture of factors – speeding, being impaired by alcohol, or feeling tired.
Below shows the breakdown of the first harmful event in these lane departure crashes.
Speeding
Speeding includes both exceeding the speed limit and driving too fast for conditions. Speeding has a compounded affect in a crash; decreasing speed can reduce the crash risk, reduce injury severity, and make it possible to control the vehicle if an event were to occur. Of all fatal and injury crashes, 15% involved speed as a contributing factor resulting in 31 fatalities and injuries in an average year. Statewide, this is 20% of fatal and injury crashes.
Comparing to road type by lane miles, U.S. roads are the most disportionate road type for fatal and injury speed crashes.
| Crash Type | 2018 | 2019 | 2020 | 2021 | 2022 | Trend |
|---|---|---|---|---|---|---|
| Fatal | 1 | 0 | 0 | 1 | 0 | |
| Injury | 33 | 20 | 22 | 26 | 22 | |
| Property Damage | 86 | 80 | 40 | 59 | 82 | |
| Total | 120 | 100 | 62 | 86 | 104 | - |
Here are trends of all
speeding-related crashes over the past 5 years.
1 out of 4 of all crashes where speed is a factor involves a young driver.
Hotspots and analysis areas of all crashes involving a speeding driver
Appendix
Predictive Analytics
Predictive Analytics is an emerging program that uses established crash trends to identify “hotspots” in a particular locality. The program is geared to promote changes in driving culture in and around crash hotspots, with a particular focus on outreach. Utilizing a Safe Systems Approach, Predictive Analytics introduces multi-pronged solutions that involves a wide array of partners and stakeholders in traffic safety working together to reduce injury crashes.
Hotspot Selection
A county or municipality may use whatever method they decide to select their own hotspots. But utilizing Community Maps, a jurisdiction can target areas that have a demonstrated history of injury crashes. For example, using the search components on the left give us the following map, with several hotspots to choose between:
If
there is a specific issue area that a locality wants to focus on (such
as impaired driving or speeding), consider using specific crash flags
when generating hotspots.
Urbanization
Douglas County is a somewhat urban county and contains part of the Duluth metropolitan area. The western and northern borders of the county are the borders of the state of Minnesota.
Vehicle Miles of Travel (VMT)3
A crash rate of ^
VMT is a measure of the total
amount of and distance of vehicle travel in a year.
In Douglas
County, the 2021 VMT was 608 million with a crash rate of 25 injury and fatal crashes per 100
million VMT, lower than the state’s rate of
39.
^Crash rate as measured by total injury and fatal crashes per 1 million vehicles miles traveled in 2021
Grants
The State Patrol Bureau of Transportation Safety and Technical Services (BOTSTS) administers federally funded overtime traffic safety grants to county task forces each year. A county task force is a group of law enforcement agencies working together to plan high visibility enforcement in their communities.
The overtime grants are awarded to agencies in task forces using
a data driven targeting process. The targeting process includes a review
of crash data from previous years to determine what areas have a traffic
safety problem. The process is used to determine locations of concern in
the areas of impaired driving, speeding, and unbelted vehicle
occupants.
To save lives and reduce injuries by preventing traffic crashes,
BOTSTS, in partnership with the National Highway Traffic Safety
Administration (NHTSA), sponsors campaigns that mobilize hundreds of law
enforcement agencies throughout the state to increase motorists’
compliance with traffic safety laws. The high-visibility law enforcement
efforts are combined with effective media campaigns to get more
motorists to buckle up, slow down and drive sober. The national
mobilizations are Click it or Ticket and Drive Sober or Get Pulled
Over.
| Agency | 2021 Click It or Ticket | 2022 Click It or Ticket | 2021 Drive Sober or Get Pulled Over - Labor Day | 2022 Drive Sober or Get Pulled Over - Labor Day | 2021 Drive Sober or Get Pulled Over - Winter Holidays | 2022 Drive Sober or Get Pulled Over - Winter Holidays |
|---|---|---|---|---|---|---|
| Douglas County SO |
|
|
|
|
|
|
| Lake Nebagamon PD |
|
|
|
|
|
|
| Superior PD |
|
|
|
|
|
|
| UW-Superior DPS |
|
|
|
|
|
|
No agencies participated in any task forces.
Abbreviations: DPS = Department of Public Safety, PD = Police Department, SO = Sheriff’s Office
Injury-to-Fatality Ratio
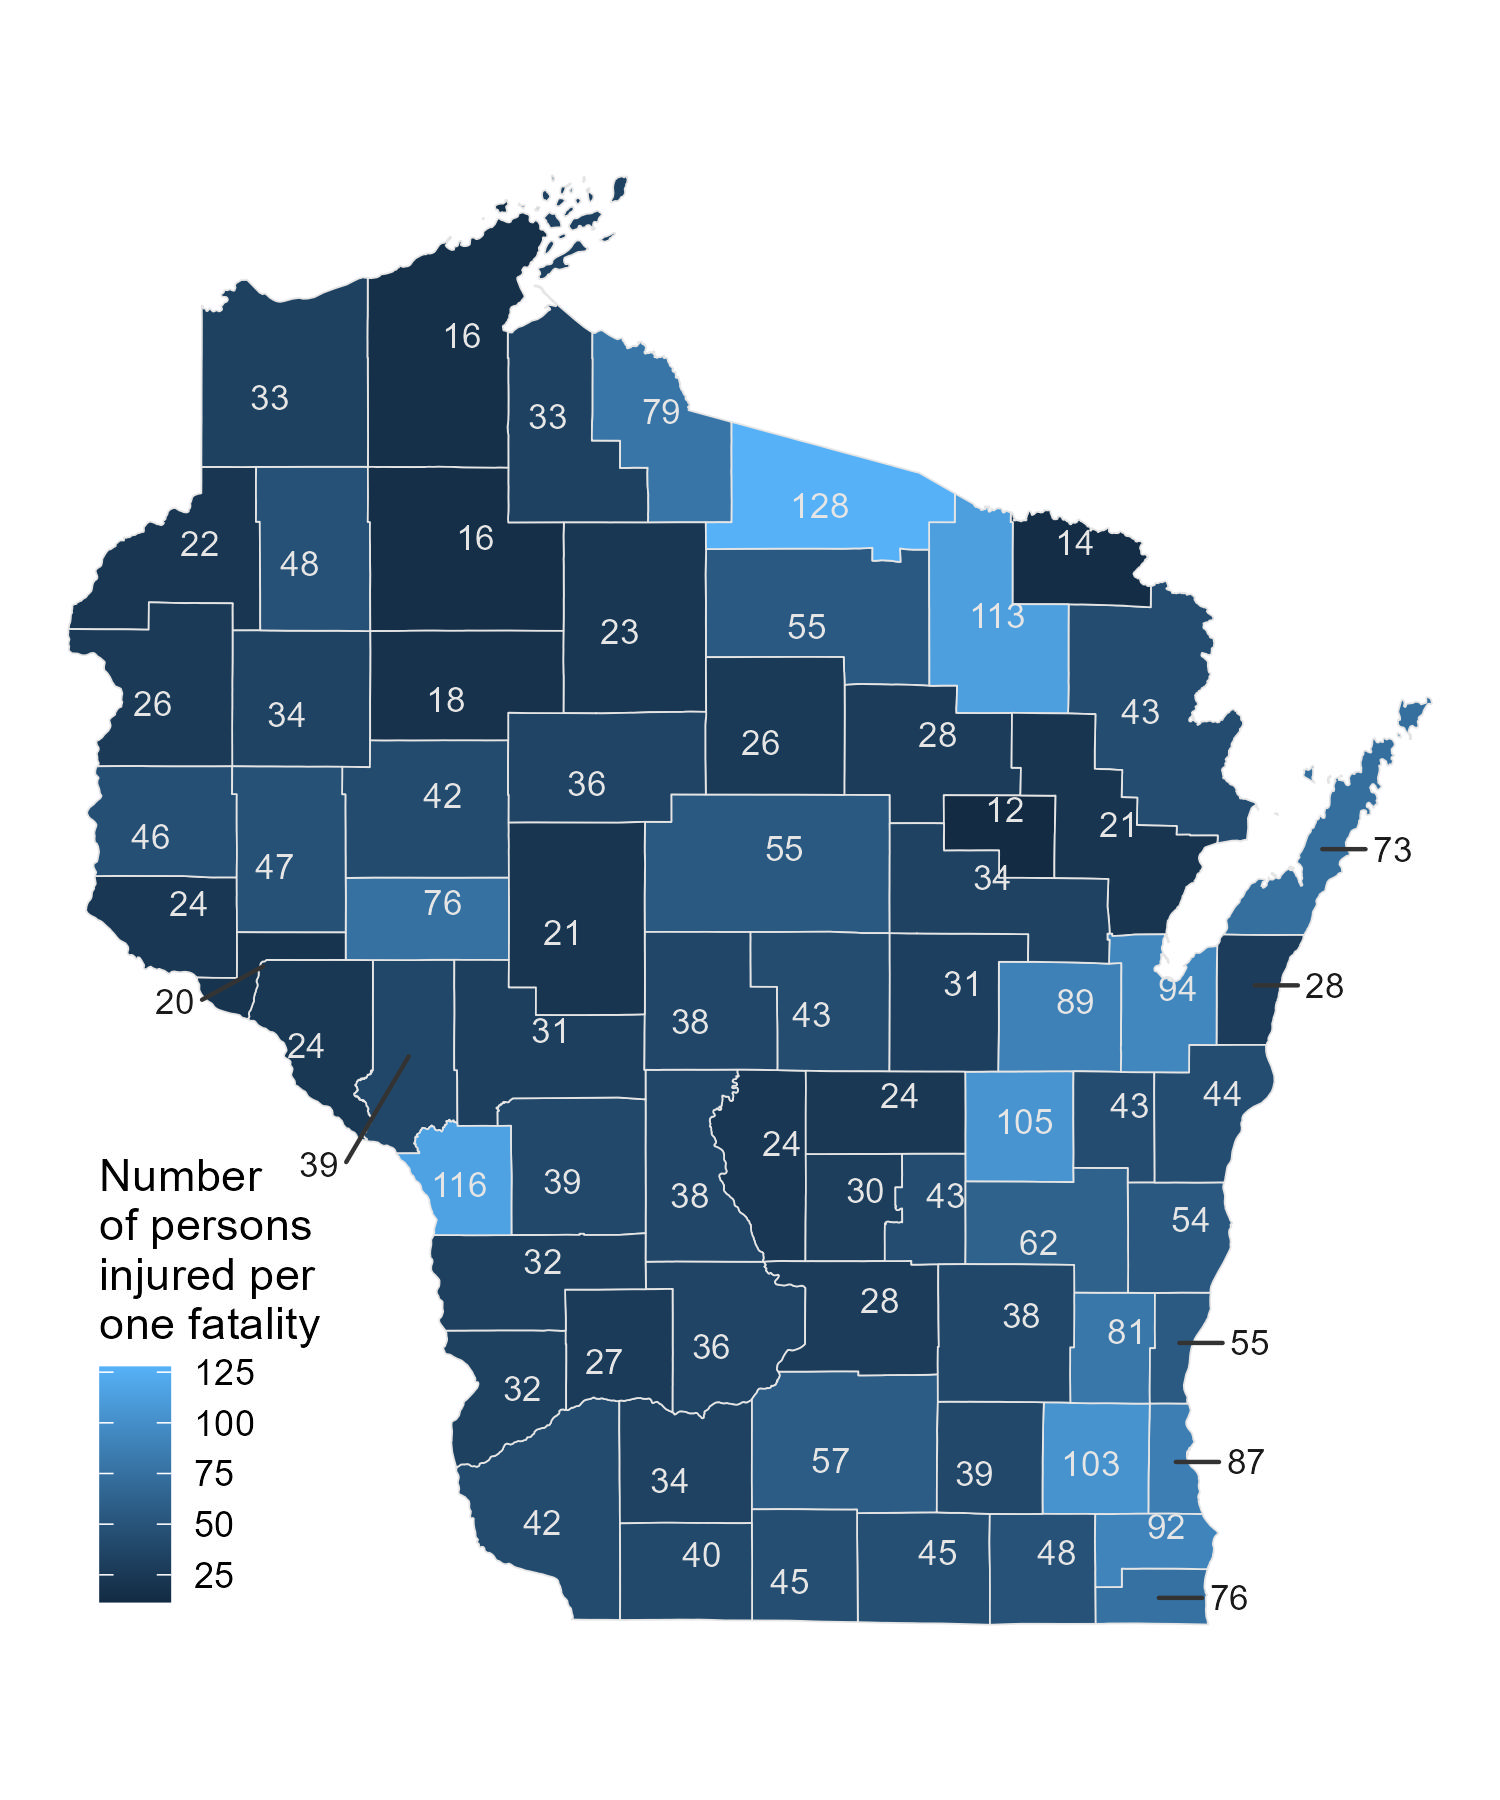
In Douglas County, for every 33
people injured, 1 person is killed. This is the injury-to-fatality ratio
and is below
average from Wisconsin where the ratio is 57 to 1.
The
injury-to-fatality ratio is computed by dividing the total number of
crash injuries by the total number of crash fatalities. A higher ratio
is more ideal since fatalities comprise a smaller proportion of total
crash victims. The ratio tends to be lower in rural areas where there’s
a higher proportion of county and state roads. Higher speed limits means
higher crash injury severity. Also rural areas generally suffer from a
longer distance to hospitals and fewer emergency response services.
Sources:
1Wisconsin Department of Transportation.
Received from K. Spencer. Dec. 3, 2019.
wisconsindot.gov/Documents/projects/data-plan/veh-miles/vmt2016-c.pdf
3Wisconsin Department of Transportation. “2021 Vehicles
Miles of Travel (VMT) by County.” Accessed May 20, 2022. https://wisconsindot.gov/Documents/projects/data-plan/veh-miles/vmt2020.pdf